
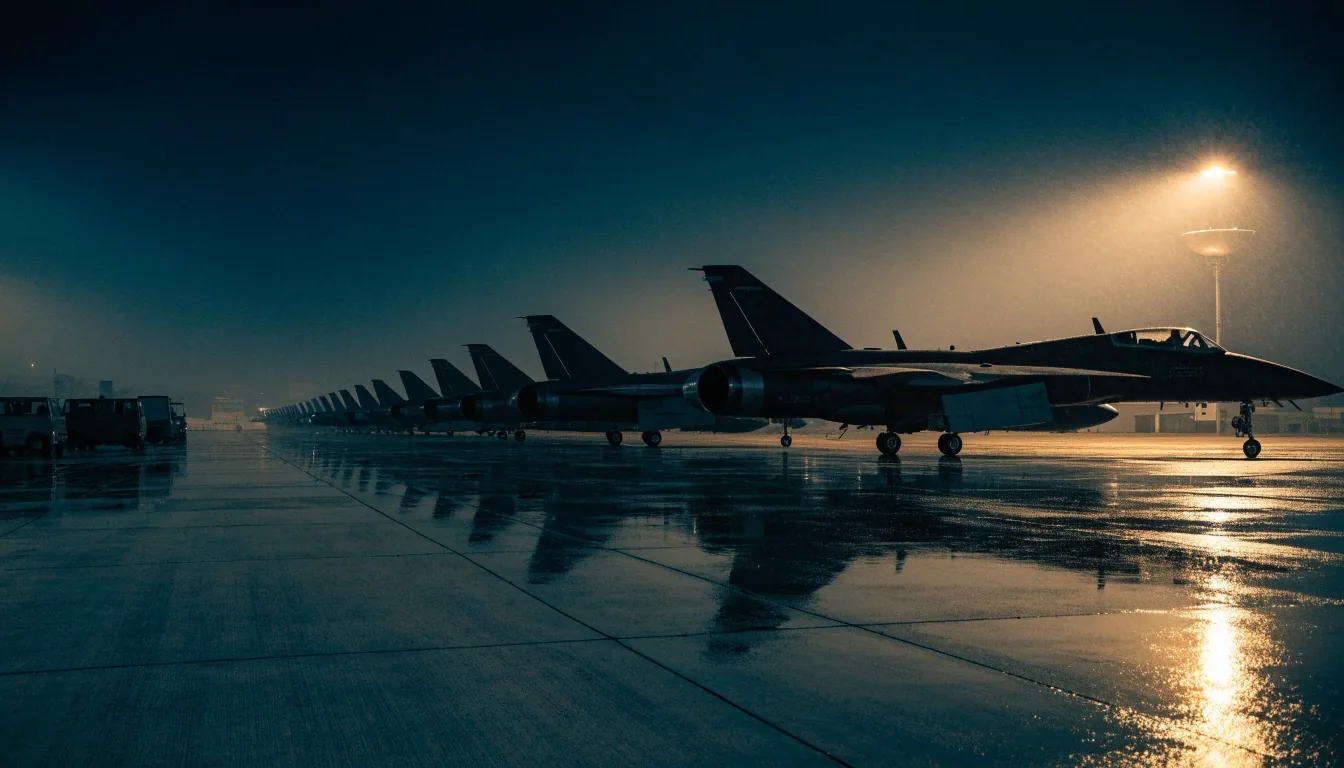
US Military Aircraft Losses in the Iran War Rise Sharply in New Report
A revised congressional tally puts the number of American aircraft lost or damaged since the operation began at 81, nearly double the figure circulated in May. This page walks through what changed, which airframes dominate the count, and why the revision matters for how the campaign is read.
What the revised count actually changes
The update from the Congressional Research Service replaces a much smaller figure that was widely quoted through the spring. The earlier number reflected losses confirmed by the time of publication, not the full set of aircraft written off after recovery, inspection, or depot assessment closed. That gap is the story: it is not an error so much as a reporting lag that the tempo of the operation has made longer.
For readers following the Iran campaign, the practical effect is that any early tally should be treated as a floor. Numbers rise as wreckage is surveyed and as damaged airframes are moved into categories that count as losses rather than repairs.

Revised tally
81
Aircraft listed as lost or damaged since the operation opened.
Earlier figure
May
The count circulated before the revision was roughly half the new total.
Direction
Up
Every revision so far has moved the number higher, not lower.
Which airframes drive the increase
The jump is not evenly spread. Most of the added entries are unmanned platforms and logistics aircraft, the categories where damage is easiest to undercount in the first weeks and hardest to hide once recovery crews finish their work. Crewed strike aircraft appear in the count too, but their share of the increase is smaller than the raw headline suggests.
- Unmanned aircraft Reaper and similar platforms carry the largest share of the added entries.
- Tankers and transports Ground damage and runway incidents account for most of the newly counted losses.
- Helicopters A handful of airframes moved from damaged to written off after depot review.
- Crewed strike aircraft Present in the tally, but a smaller contributor to the month-over-month change.
The cost question behind the number
A loss tally is a proxy. It signals how much exposure the operation is generating and how hard the supporting system is working to keep aircraft in the air. Read carefully, the revision describes tempo as much as attrition.
Replacement is slower than loss
Airframes leave the inventory faster than production lines can add them. A rising count therefore compounds pressure on training, spare parts, and crew rest cycles that were already tight.
Sorties per loss
The ratio of flying to losses is the honest cost measure, and it only becomes visible once both numbers are settled. That is why analysts wait for revisions instead of trusting the first week.
What stays unknown
Damage that never leaves a repair shop may never be published. Any public total is a documented floor, not a complete account.
How to read the next revision before it lands
Readers who want to follow this story closely should track three things: the assessment closure date attached to each entry, the split between damaged and destroyed airframes, and whether the count is described as confirmed or provisional. Those three details decide how much the next update is likely to move.
Related reporting from the same edition
Questions readers keep asking
Short answers about how these figures are assembled and what they do not tell you.

Why did the figure nearly double?
The earlier count was a snapshot taken while assessments were still open. The revision reflects recovered airframes and completed damage evaluations that closed after the first publication, adding roughly as many entries again as the initial total held.
Does "lost or damaged" mean the same as destroyed?
No. The category covers airframes that are out of service, which includes aircraft written off entirely and those sitting in long-term repair. The distinction matters because a damaged airframe may return, while a written-off one will not.
Where do these numbers come from?
Congressional research updates assemble figures from official notifications and subsequent assessment reporting. Public totals can lag the internal record by weeks, which is the single most common reason successive reports disagree.
Should the next report be expected to rise again?
Revisions have moved in one direction so far, but that pattern is not a forecast. The honest expectation is that any total published before assessments close will read low, and that the size of the next change depends on how many cases clear in the intervening weeks.
How does this compare with previous campaigns?
Comparisons need matched windows and matched categories, which rarely exist in public reporting. The safer approach is to compare revisions of the same campaign over time, where definitions stay consistent, rather than to compare across conflicts.
Where this coverage goes next
Winslow Arsenault follows the Iran campaign through the documents that move the story: research updates, market reaction, and diplomatic signals. If you want the next revision the day it circulates, the defense desk and the newsletter are the two places to watch.
Newsroom
Winslow Arsenault
370 E 31st St, Brooklyn, NY 11226, USA
StacyPhillips@winslowarsenault.com
Monday to Friday, 9:00 AM – 6:00 PM